A few years back, I found deresute.me, which was developed by marcan on GitHub. Any Producer could put in their nine digit game ID and have a nice little banner generated, similar to the one below:

I thought it was pretty cool, having the stats displayed and even my leader idol’s card icon displayed. It reminded of the times when people used to have fancy signatures on various forums back in the day. There was one additional feature that marcan exposed, and that was a nice JSON dump of the fetched data used in the banner generation, and some more. I am extremely grateful to marcan for having this site and its unofficial JSON dump available, and encourage you to check out his other projects on GitHub (some of it flies over my head cause I don’t fully understand, but he has some interesting posts on social media that I enjoy reading occasionally here and there).
Anyways, back in June of 2019, I started to collect deresute data for myself and some of my friends. I created a small hourly cronjob that would perform a wget of each of our JSON dumps and store it as-is. Later on, I created a little Python script that would use matplotlib to graph this data and save it as an image. It looked something like this:
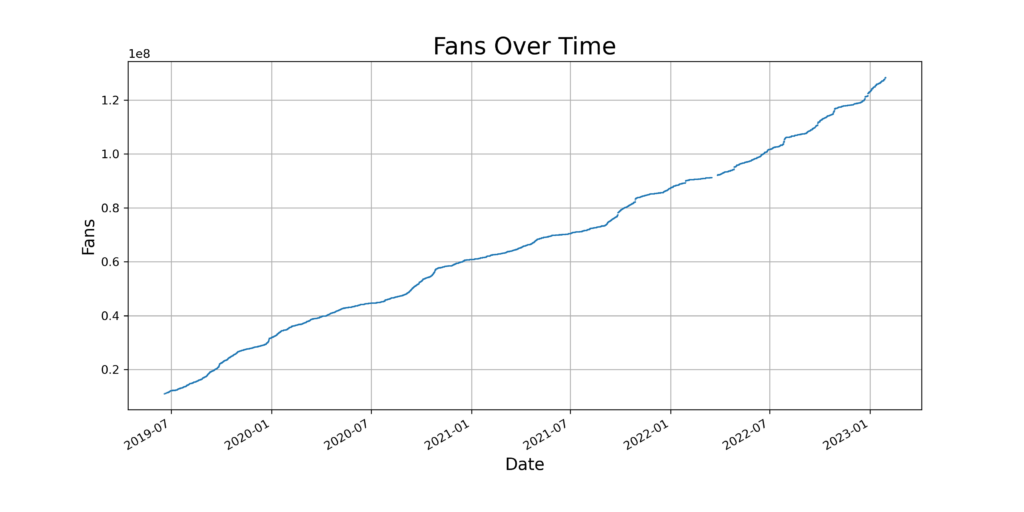
One downside about these images is that they’re static: they need to be re-generated every time new data is fetched. It also mean that interactively is non-existent: I can’t see exactly how many fans I had on July 7, 2020, per se. This meant that inspecting data “on-the-fly” was out of the picture.
Luckily, at work, my team occasionally used Grafana to visualize certain statistics, but neither myself or my team built these dashboards: we had another internal team build them. Given I had collected a bunch of data that was also timestamped sitting around, I eventually clued in and realized that Grafana could probably be used to visual this deresute data that I had collected. As such, I decided to dive head first into Grafana to see if I could visualize my game data.
Preparing the infra and data
Integrating Grafana into my current setup was pretty straightforward, thanks to myself for converting to Docker containers. I only had to spin up a container with a Grafana image, and I was on my way. In order to integrate it with the rest of my containers, I set it up behind my apache2 containers and added a VirtualHost to act as a reverse proxy. Thankfully, I had used reverse proxies in the past, so that was also straightforward to configure. With a subdomain configured and SSL certificates acquired through existing scripts, I was ready to get going!
Unfortunately, one thing remained: the collected data needed to be in some data storage facility instead of just a bunch of raw JSON files. Given I had a SQL database at my disposal, I created a schema for deresute with some tables (SQL script here). Afterwards, I wrote another script to parse through the 25k+ JSON files per person that I had collected. That took a few hours since I was processing them via the network.
I also screwed up with the timestamps while inserting them into the database. Grafana expects all timestamps to be in UTC, but I inserted them in the US/Pacific timezone. I had to make a series of timestamp adjustments after the fact, similar to the snippet below. Although it took approximately 25 minutes to run through all the timestamp changes, it was definitely much faster than having to re-insert all the entries into the database.
mysql> UPDATE deresute.cardInfo
SET timestamp = DATE_ADD(timestamp, INTERVAL 8 HOUR)
ORDER BY timestamp DESC;
Query OK, 986740 rows affected (15 min 49.56 sec)
Rows matched: 986740  Changed: 986740  Warnings: 0
mysql> UPDATE deresute.basicInfo
SET timestamp = DATE_ADD(timestamp, INTERVAL 8 HOUR)
ORDER BY timestamp DESC;
Query OK, 197348 rows affected (6 min 17.61 sec)
Rows matched: 197348  Changed: 197348  Warnings: 0
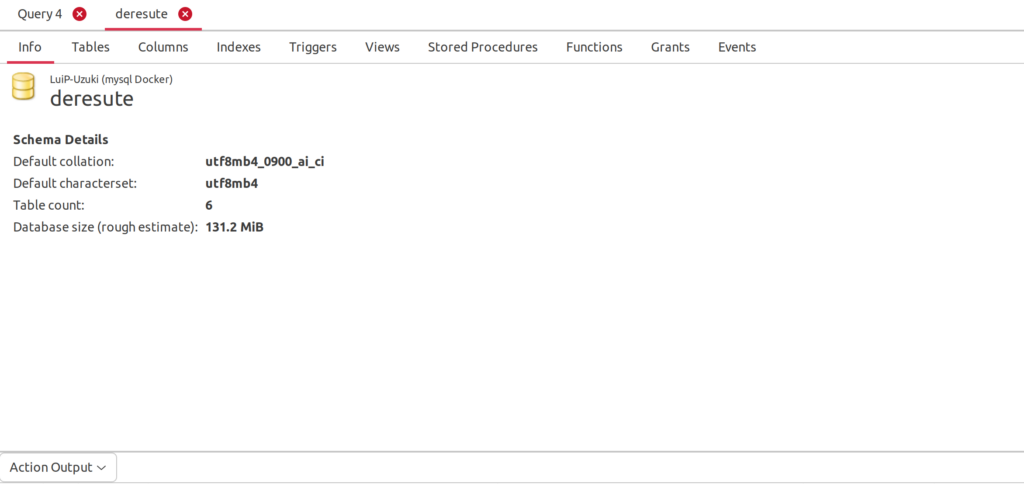
Since there were plenty of rows to insert, I also ran OPTIMIZE TABLE on each table, and reduced the size of these tables from ~700MB to ~130MB. The JSON files are much more bloated in comparison, so this was nice.
Visualizing the data
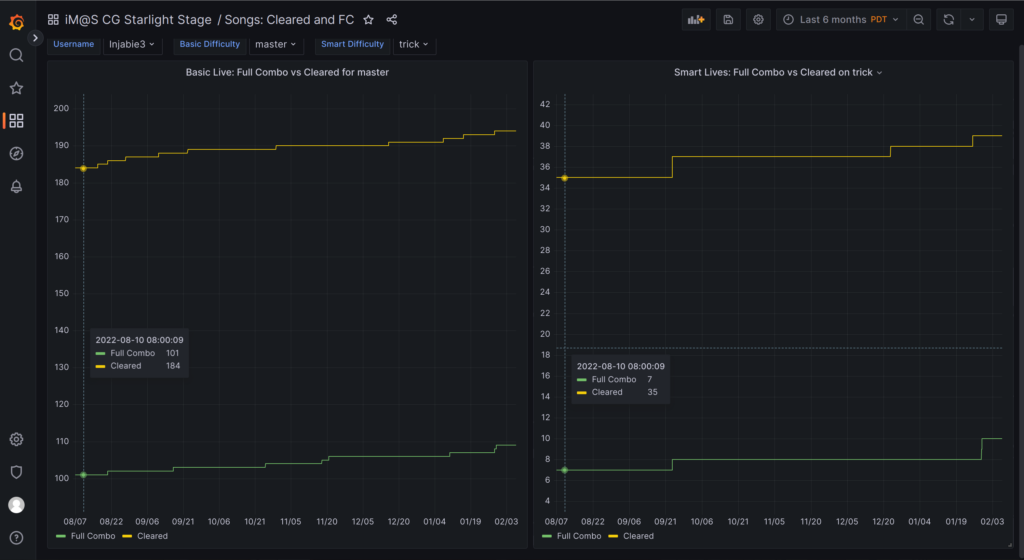
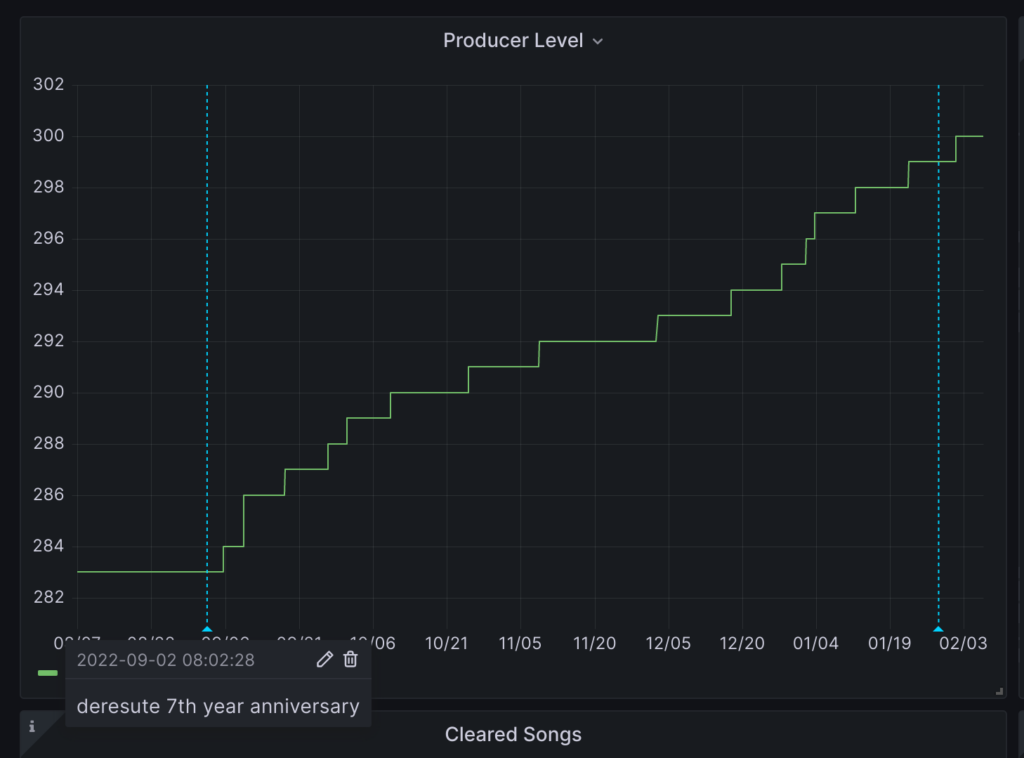
Okay, so with my newbie mistakes out of the way, I can finally get to visualizing some data! I converted the original matplotlib graphs into their own graphs on Grafana. The nice thing is that now the graphs are generated on the fly, and I can zoom into times that I’m interested in and get a closer look at things. I also did a breakdown of the number of songs that have been cleared once and the number of songs that have been full combo’d once, and shown their respective values on this particular dashboard.
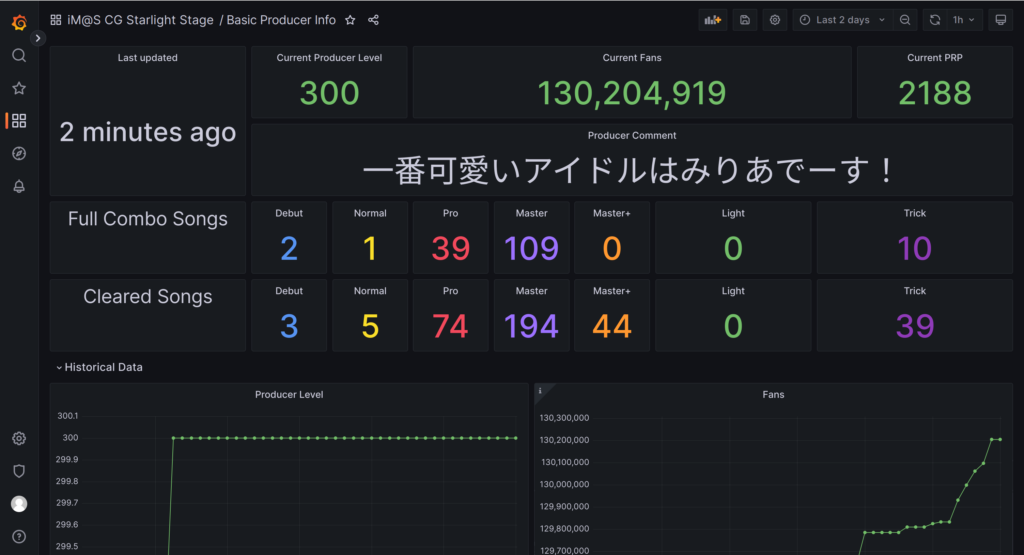
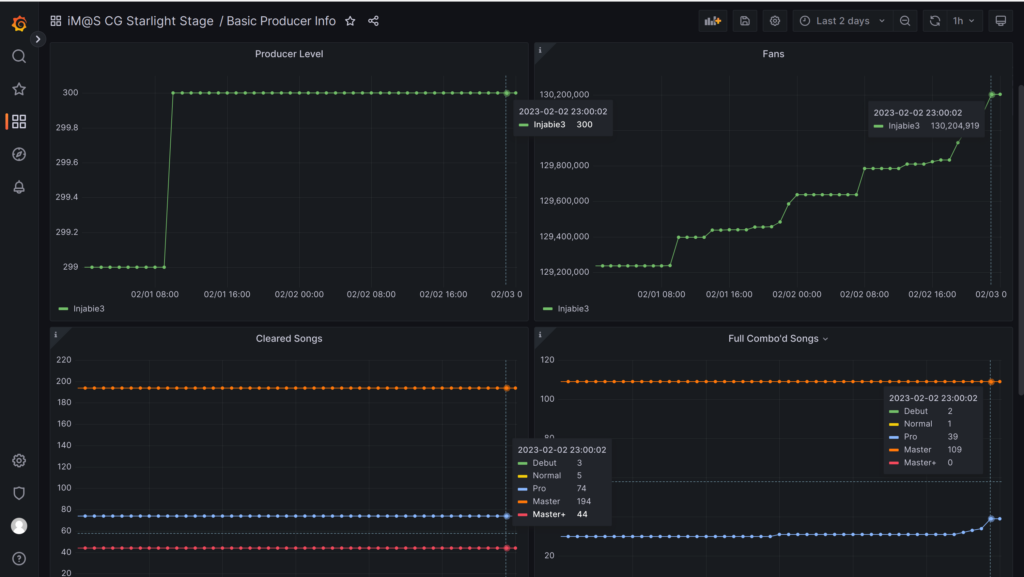
It’s been interesting to look back at my play history. There were times where my PLv and fan growth were much faster, and I could attribute it to certain events within the game, like 2x EXP and fans during the game’s anniversary month. Within Grafana, I’m able to annotate graphs to quickly spot things such as those anniversary start dates. It definitely helps to quickly remind myself of such events and whatnot, so that was also pretty cool.
I also made another dashboard that compares unique song clears and full combos that’s filterable by difficulty, so that was also neat to see those trends. Maybe this will finally motivate me to do better and get my full combo counts higher to match the clear counts. 😀
What’s next?
The graphs I have right now are still very much a work-in-progress. I’m still working on getting some comparison dashboards working so that I can compare some stats with some of my friends. There’s also another dashboard I want to get working that can show growth within a given time period. I also do want to write a test to run every day that just fetches a single JSON file and check the keys to see if anything has changed.
It’s been fun working on getting this data up and into a central database to finally see my own stats. I think that projects that are closely related to me personally, like these game statistics, really make trying these things out fun and educational. That being said, life still continues on with work and family, so I’ll try to see when I can find time to continue working on this.
Anyways, that’s all I have for now. Figure post soon, maybe.
Until next time,
~Lui
